
Pie Chart Example
Ce contenu n’est pas encore disponible dans votre langue.
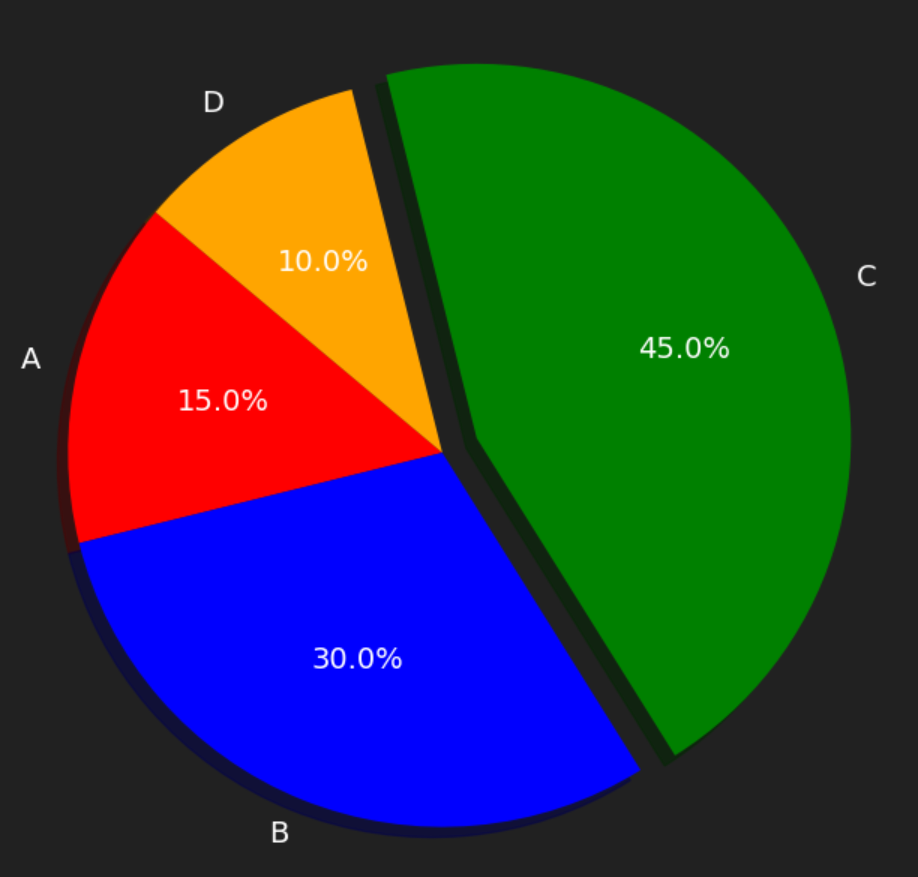
https://api.cookie-api.com/api/charts/pie_chart| Parameter | Type | Required | Description |
|---|---|---|---|
labels | array | Yes | Labels for the pie chart slices |
sizes | array | Yes | Sizes of each pie slice; comma-separated numerical values |
colors | array | No | Colors for each slice; comma-separated names or hex codes (e.g., “red”, “#FF5733”) |
explode | array | No | Slice separations; comma-separated float values |
curl --location 'https://api.cookie-api.com/api/charts/pie_chart?labels=Label1,Label2,Label3&sizes=30,40,30&colors=red,blue,green&explode=0,0.1,0'Pie Chart Example
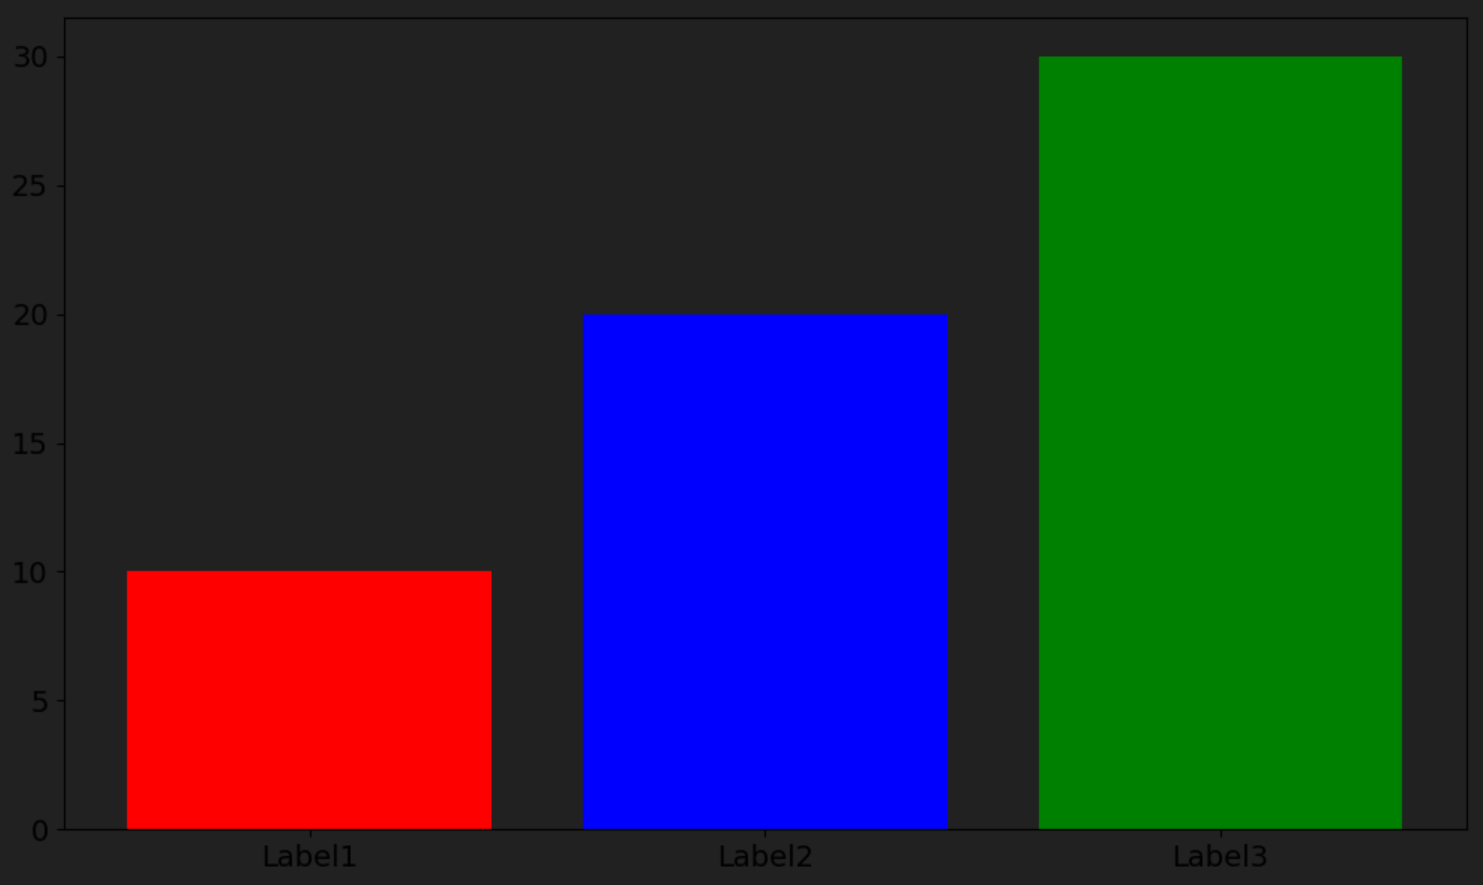
https://api.cookie-api.com/api/charts/bar_chart| Parameter | Type | Required | Description |
|---|---|---|---|
labels | array | Yes | Labels for each bar in the chart |
values | array | Yes | Values for each bar; comma-separated numerical values |
colors | array | No | Colors for each bar; comma-separated names or hex codes (e.g., “red”, “#FF5733”) |
curl --location 'https://api.cookie-api.com/api/charts/bar_chart?labels=Label1,Label2,Label3&values=10,20,30&colors=red,blue,green'Pie Chart Example
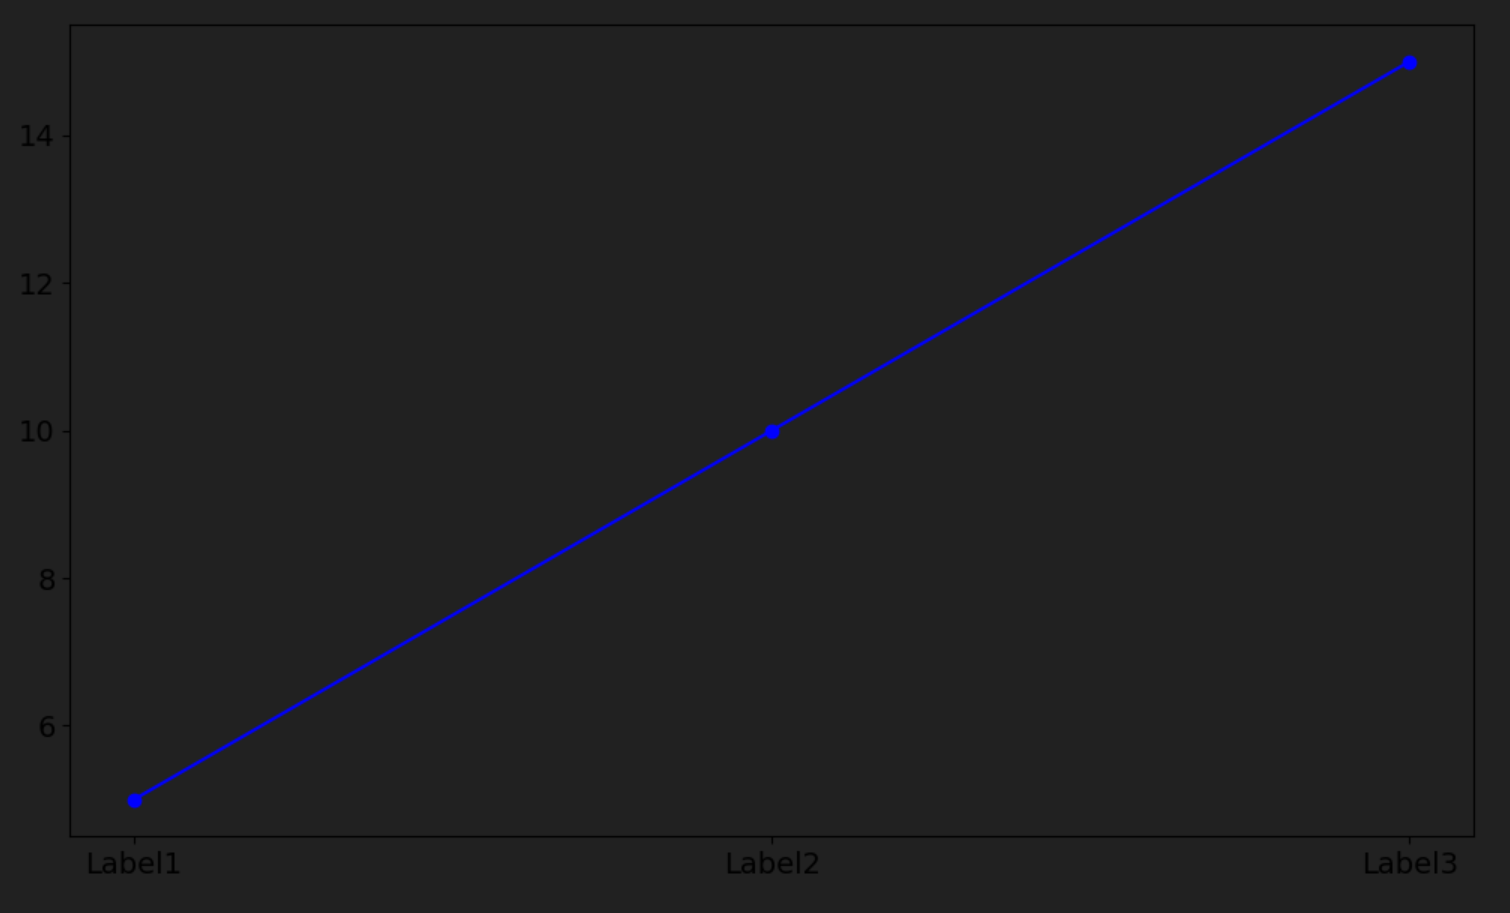
https://api.cookie-api.com/api/charts/line_chart| Parameter | Type | Required | Description |
|---|---|---|---|
labels | array | Yes | Labels for each data point on the x-axis |
values | array | Yes | Y-axis values for each point; comma-separated numerical values |
colors | string | No | Color for the line; name (e.g., “red”) or hex code (e.g., “#FF5733”) |
curl --location 'https://api.cookie-api.com/api/charts/line_chart?labels=Label1,Label2,Label3&values=5,10,15&colors=blue'Line Chart Example
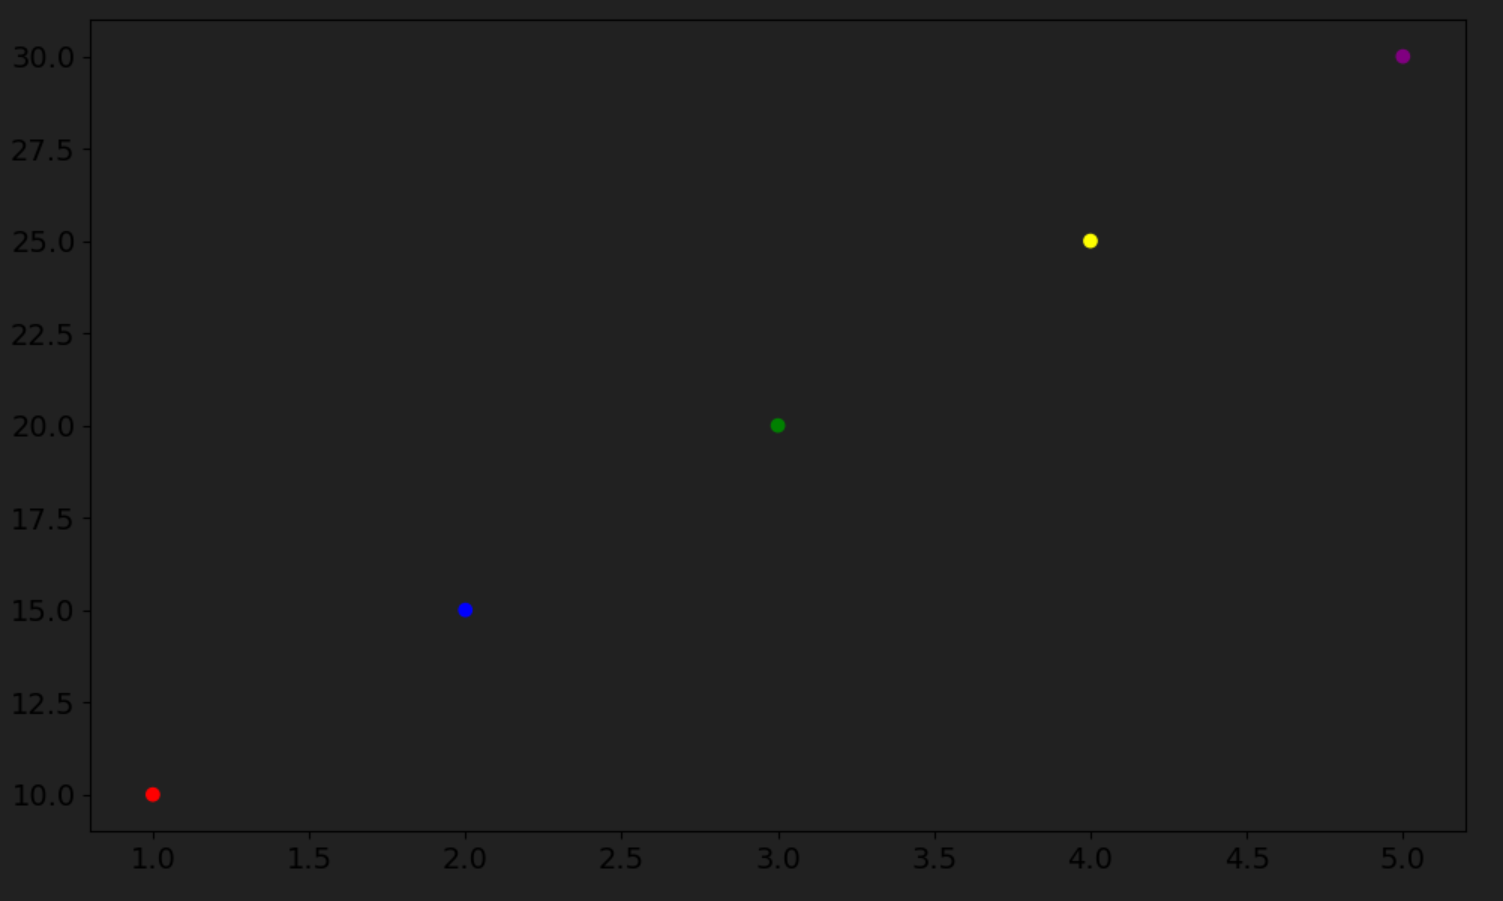
https://api.cookie-api.com/api/charts/scatter_plot| Parameter | Type | Required | Description |
|---|---|---|---|
x_values | array | Yes | X-axis values; comma-separated numerical values |
y_values | array | Yes | Y-axis values; comma-separated numerical values |
colors | array | No | Colors for each point; comma-separated names or hex codes (e.g., “red”, “#FF5733”) |
curl --location 'https://api.cookie-api.com/api/charts/scatter_plot?x_values=1,2,3,4,5&y_values=10,15,20,25,30&colors=red,blue,green,yellow,purple'Scatter Plot Example
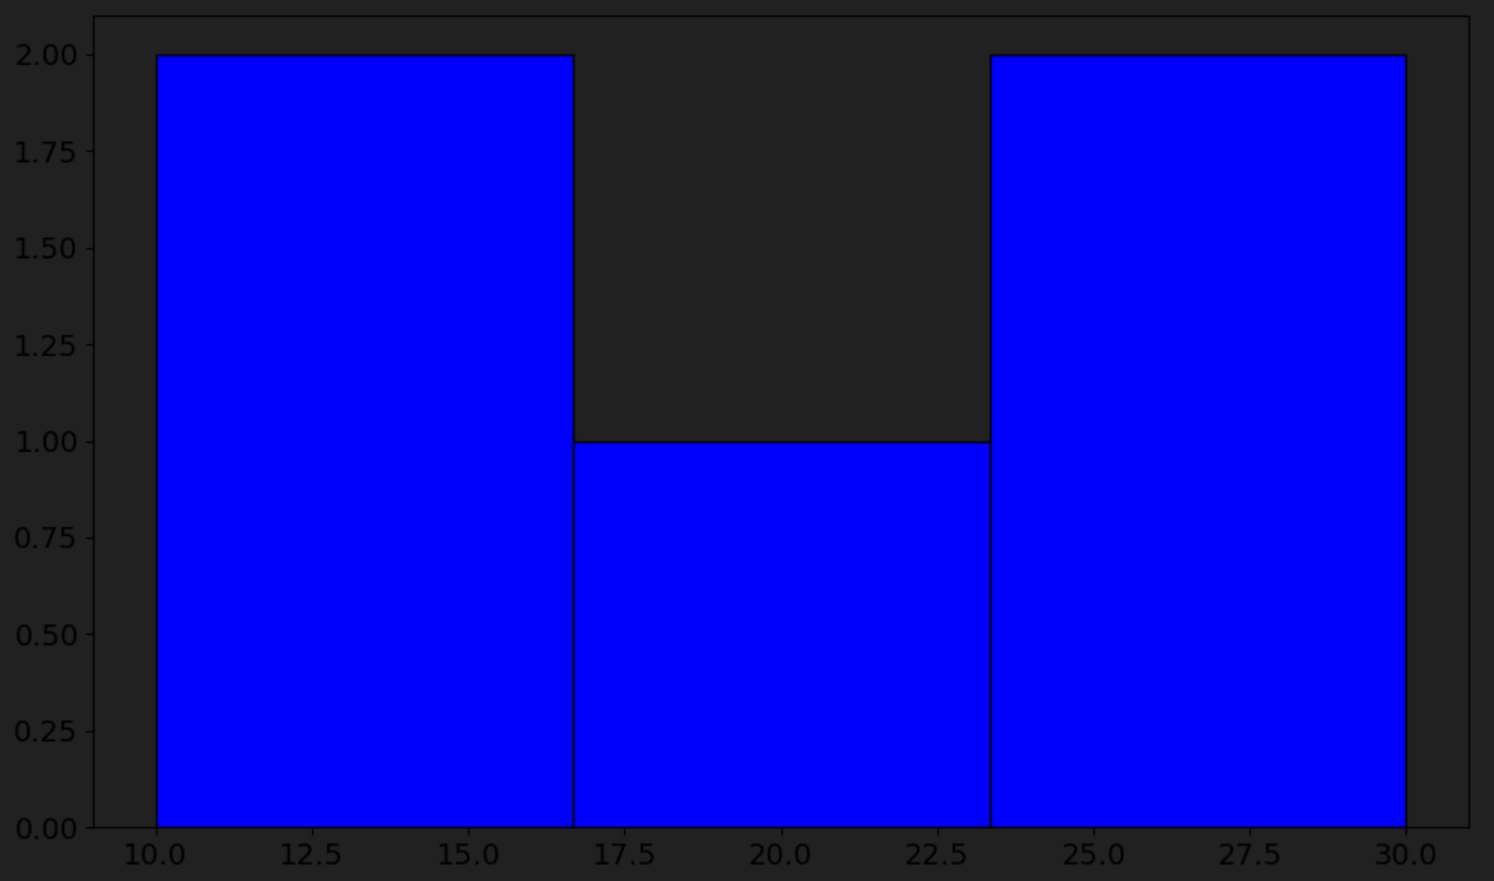
https://api.cookie-api.com/api/charts/histogram| Parameter | Type | Required | Description |
|---|---|---|---|
values | array | Yes | Values for the histogram; comma-separated numerical values |
bins | integer | No | Number of bins in the histogram |
colors | string | No | Color for histogram bars; name (e.g., “red”) or hex code (e.g., “#FF5733”) |
curl --location 'https://api.cookie-api.com/api/charts/histogram?values=10,15,20&bins=3&colors=blue'Histogram Example