Pie Chart Example
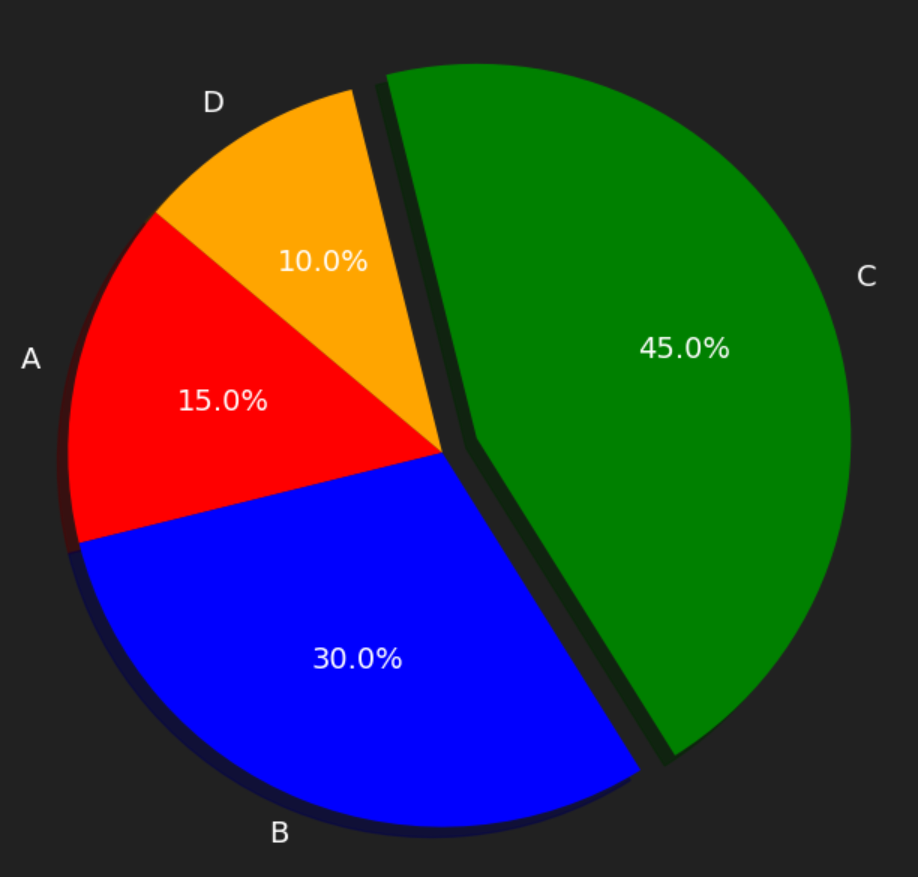
https://api.cookie-api.com/api/charts/pie_chart| URL Parameters | |
|---|---|
| labels | Labels in the pie chart. |
| sizes | Size of each pie slice. Comma-separated list of numerical values. |
| colors optional | Colors of each pie slice. Comma-separated list of color names (e.g., "red", "blue") or hexadecimal color codes (e.g., "#FF5733"). |
| explode optional | Separation of a part from the pie chart. Comma-separated list of float values. |
curl --location 'https://api.cookie-api.com/api/charts/pie_chart?labels=Label1,Label2,Label3&sizes=30,40,30&colors=red,blue,green&explode=0,0.1,0'Pie Chart Example
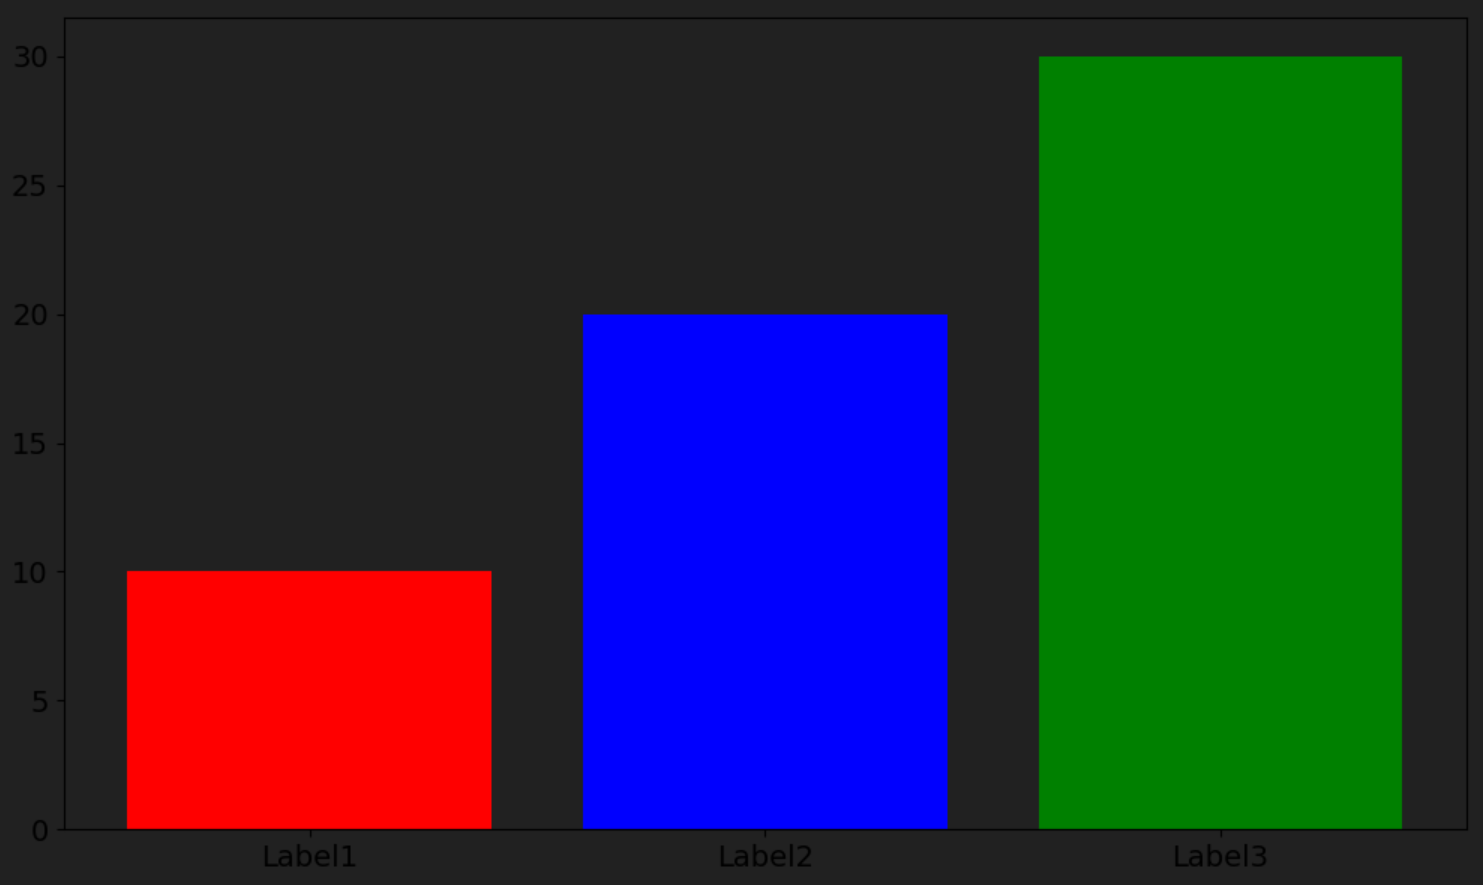
https://api.cookie-api.com/api/charts/bar_chart| URL Parameters | |
|---|---|
| labels | Labels for each bar in the chart. |
| values | Values corresponding to each bar. Comma-separated list of numerical values. |
| colors optional | Colors for each bar. Comma-separated list of color names (e.g., "red", "blue") or hexadecimal color codes (e.g., "#FF5733"). |
curl --location 'https://api.cookie-api.com/api/charts/bar_chart?labels=Label1,Label2,Label3&values=10,20,30&colors=red,blue,green'Pie Chart Example
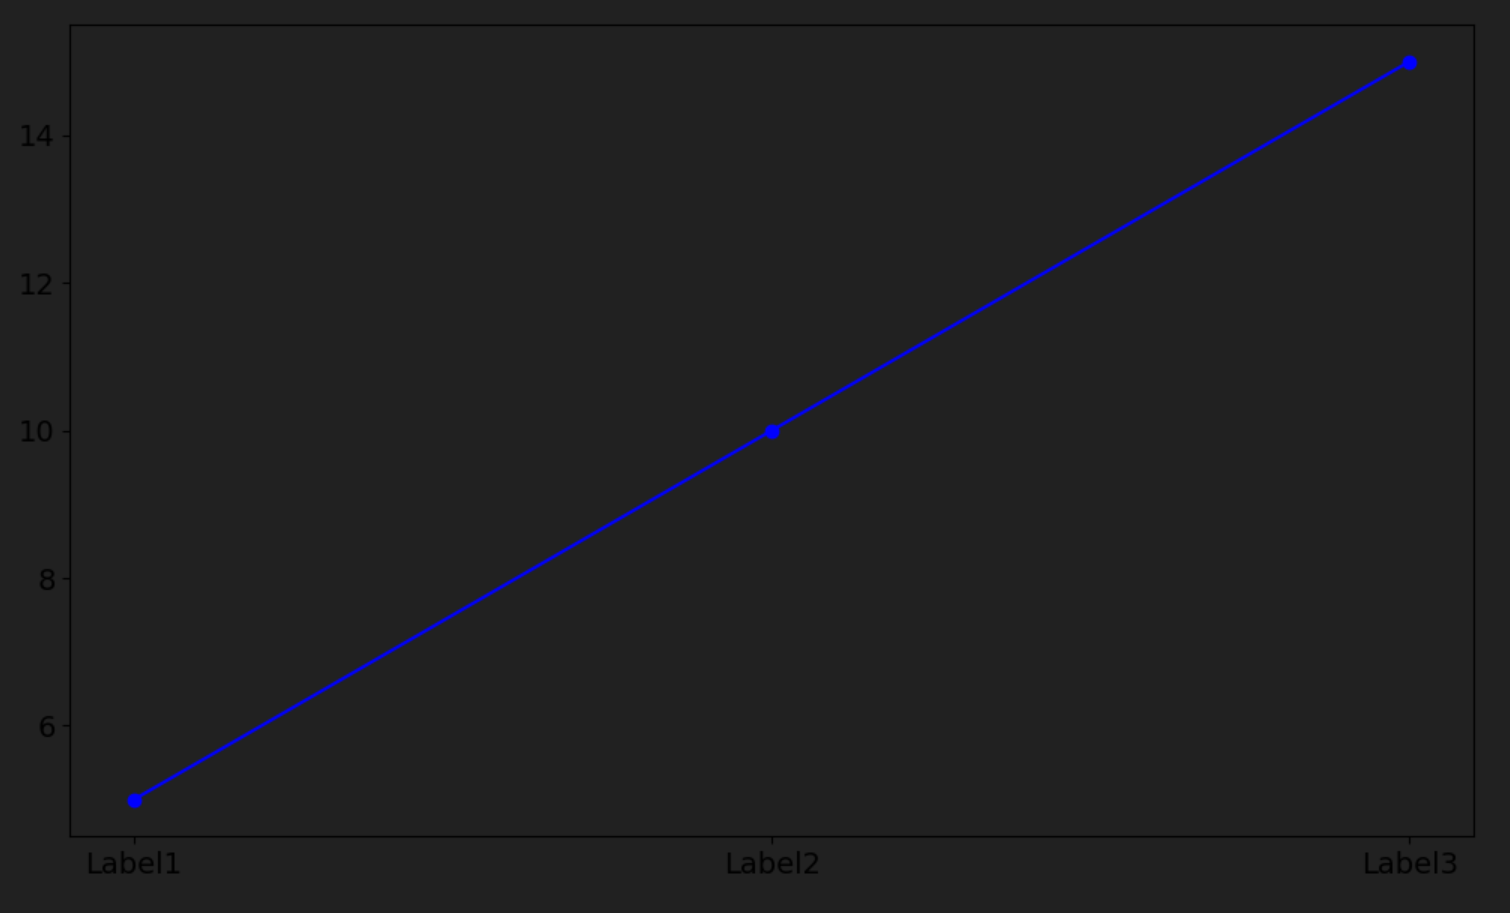
https://api.cookie-api.com/api/charts/line_chart| URL Parameters | |
|---|---|
| labels | Labels for each data point on the x-axis. |
| values | Values corresponding to each data point on the y-axis. Comma-separated list of numerical values. |
| colors optional | Color for the line. Color name (e.g., "red", "blue") or hexadecimal color code (e.g., "#FF5733"). |
curl --location 'https://api.cookie-api.com/api/charts/line_chart?labels=Label1,Label2,Label3&values=5,10,15&colors=blue'Line Chart Example
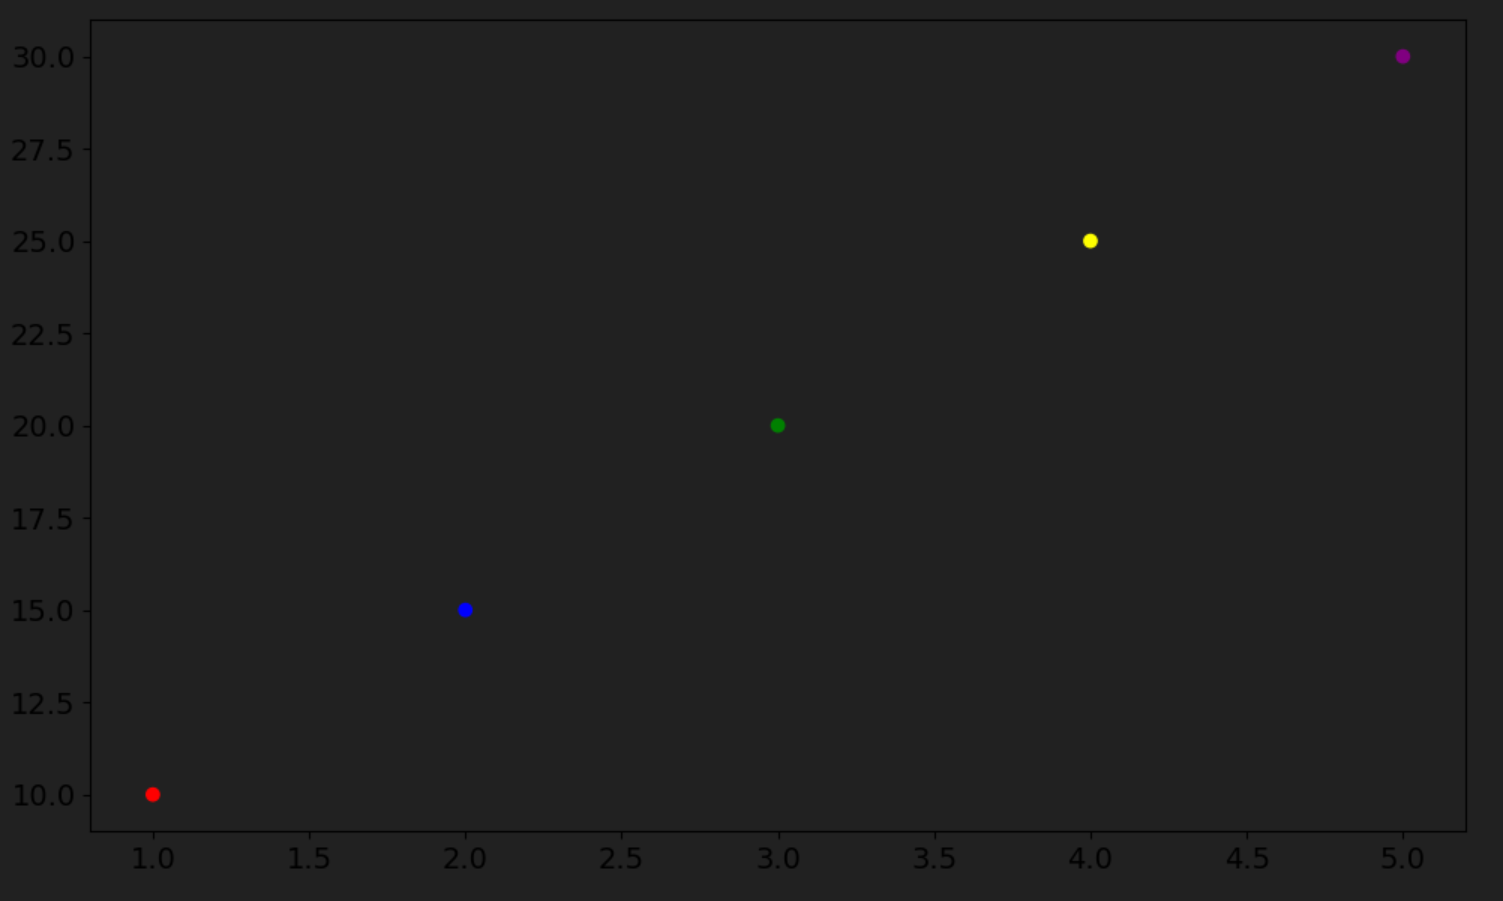
https://api.cookie-api.com/api/charts/scatter_plot| URL Parameters | |
|---|---|
| x_values | Values for the x-axis. Comma-separated list of numerical values. |
| y_values | Values for the y-axis. Comma-separated list of numerical values. |
| colors optional | Colors for each data point. Comma-separated list of color names (e.g., "red", "blue") or hexadecimal color codes (e.g., "#FF5733"). |
curl --location 'https://api.cookie-api.com/api/charts/scatter_plot?x_values=1,2,3,4,5&y_values=10,15,20,25,30&colors=red,blue,green,yellow,purple'Scatter Plot Example
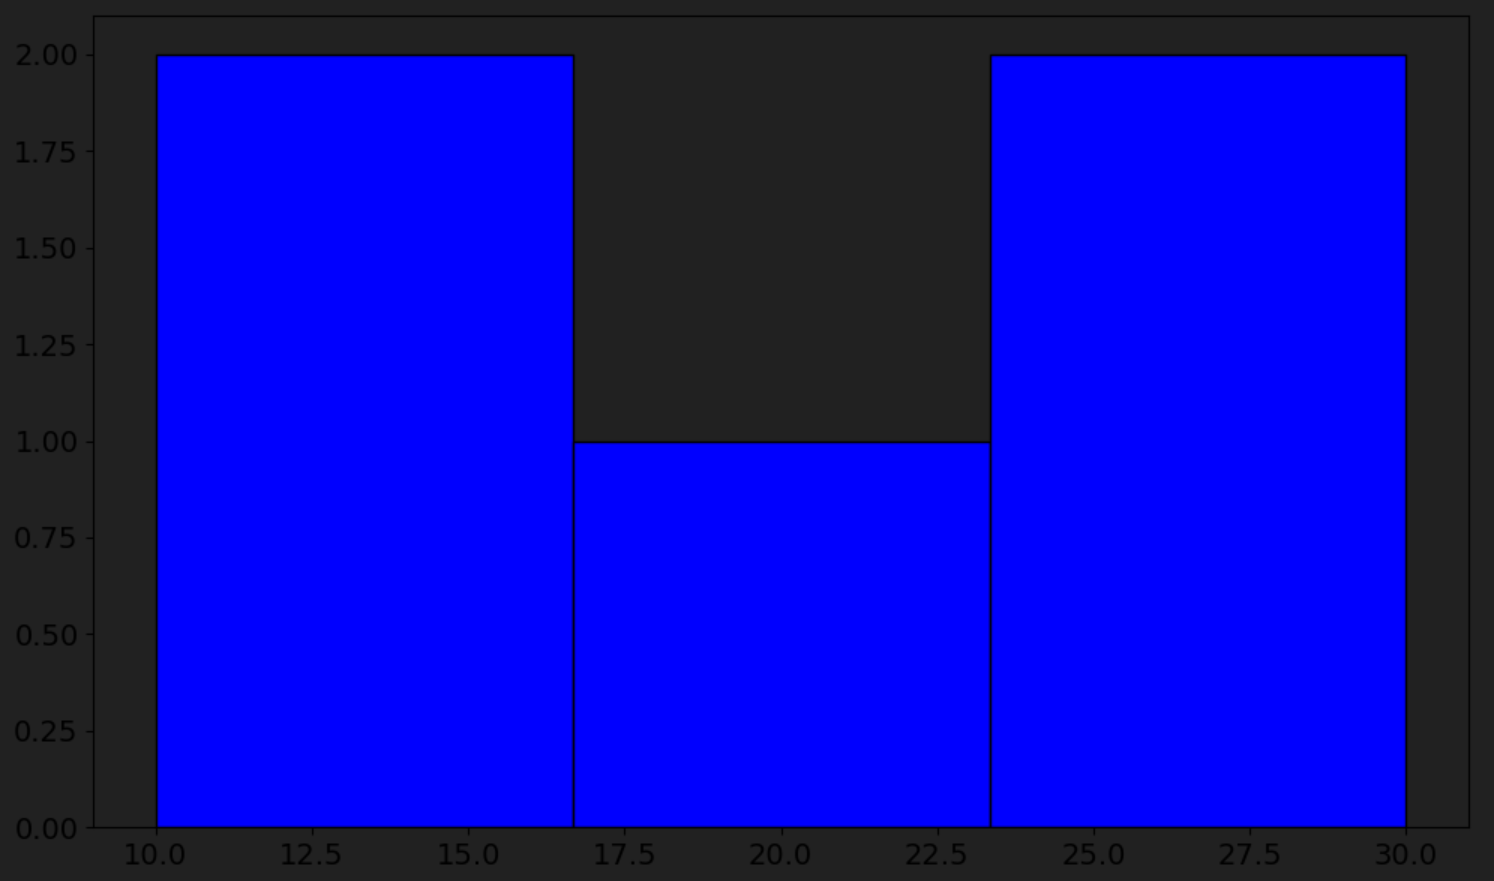
https://api.cookie-api.com/api/charts/histogram| URL Parameters | |
|---|---|
| values | Values to be plotted in the histogram. Comma-separated list of numerical values. |
| bins optional | Number of bins in the histogram. Integer value. |
| colors optional | Color for the histogram bars. Color name (e.g., "red", "blue") or hexadecimal color code (e.g., "#FF5733"). |
curl --location 'https://api.cookie-api.com/api/charts/histogram?values=10,15,20&bins=3&colors=blue'Histogram Example